
Scientific concept two: Land Use and Land Cover (LULC)
This newsletter defines LULC, explores its applications in nature data analysis workflows, and sets out what to expect from common LULC datasets.

Our first newsletter made the case for taking a scientific approach to nature data and introduced our first scientific concept, Plant Biomass. Today we're introducing our second scientific concept, Land Use and Land Cover (LULC). This newsletter defines LULC, explores its applications in nature data workflows, and sets out what to expect from common LULC datasets.
Previous newsletters have explored the foundations of nature data – from spatial data standards and libraries, to nature data sharing. Our last newsletter explored nature data licensing as a key resource in our Nature Data Sharing Initiative (NDSI).
Understanding LULC
The Earth’s surface is a mosaic of natural and human features. Land use and land cover are two overlapping concepts that systematically classify the land surface into a set of named classes: what physically exists (land cover) and how humans are using it (land use).
Land cover: The physical reality
Land cover describes what’s physically present on the land surface. Common classes include:

Land use: Human activity
Land use describes how humans use the land surface. While classifications vary between data sources, common classes include:

How land cover and land use interact
Through the use of land cover and land use together, LULC acts as a standard language for describing what exists at any location at a given point in time.
Land cover is a spatially explicit concept, meaning that a single location cannot be classified as more than one land cover class (e.g. water and forest). Land use also tends to be spatially explicit, although it is possible for there to be some overlap between land use classes (e.g. recreational and protected areas).
In combination, land use and land cover are not spatially explicit, in that it is common for a single location to have both a land use and land cover class. A real-world example of this is a forest national park, which is forest (land cover) and a protected area (land use).

Read our LULC concept note to learn more about LULC as a scientific concept.
LULC use cases
LULC data serves multiple purposes in nature data workflows:
Operational value
LULC is of direct value to operational workflows. Examples include enabling natural hazards monitoring (e.g. landslips), guiding management planning (e.g. new planting), tracking change over time (e.g. forest growth), and informing urban and regional planning.
Regulatory compliance
LULC data supports compliance with multiple regulatory frameworks. For instance, land cover change from forest to another LULC class is necessary to identify historic deforestation for the EU’s Deforestation Regulation (EUDR). LULC is also used by companies evaluating their dependencies and impacts on nature through the Taskforce for Nature-Related Financial Disclosures (TNFD) LEAP approach.
Supporting other scientific concepts
LULC provides useful context to other scientific concepts. For instance, when combined with plant biomass data, LULC data can help explain why biomass varies over space and time, support the selection of appropriate data sources (e.g. products optimised for moist tropical forest), and guide stratified sampling strategies for field measurements.
LULC also unlocks new use cases that require LULC plus plant biomass data, such as identifying candidate sites for forest regeneration.
LULC datasets
Quantifying LULC
LULC is usually represented as a grid of pixels, where each pixel is assigned a single class, probabilities for multiple classes, or even a fractional cover for one or more classes. These classes can be used directly or aggregated to calculate the proportion of each class in a given area, such as a forestry asset or national park.
Most LULC datasets are generated using machine learning models trained on multispectral satellite data. While land cover classifications can be determined from satellite data alone, additional data sources, like socioeconomic information, government data, and road networks, are usually necessary for determining land use classifications.
Dataset performance varies by region and class type. Global products like Dynamic World enable standardised analysis across regions by using consistent methods and classes worldwide. In contrast, national datasets, like the USGS National Land Cover Database, optimise their methods and classifications for local contexts, offering deeper insight within specific regions but reduced comparability between them.
Common LULC datasets
A slew of LULC datasets have become available in recent years, differing in methodology, coverage and resolution, and the classes they use. Some examples include:
Example: Dynamic World
To illustrate how LULC datasets inform nature analysis, let's explore Google and WRI’s Dynamic World dataset – which is available on the Cecil platform. The dataset delivers global land cover data at 10 m spatial resolution with 2-5 day temporal frequency from 2015 to present, using Sentinel-2 satellite data to classify nine land cover types.
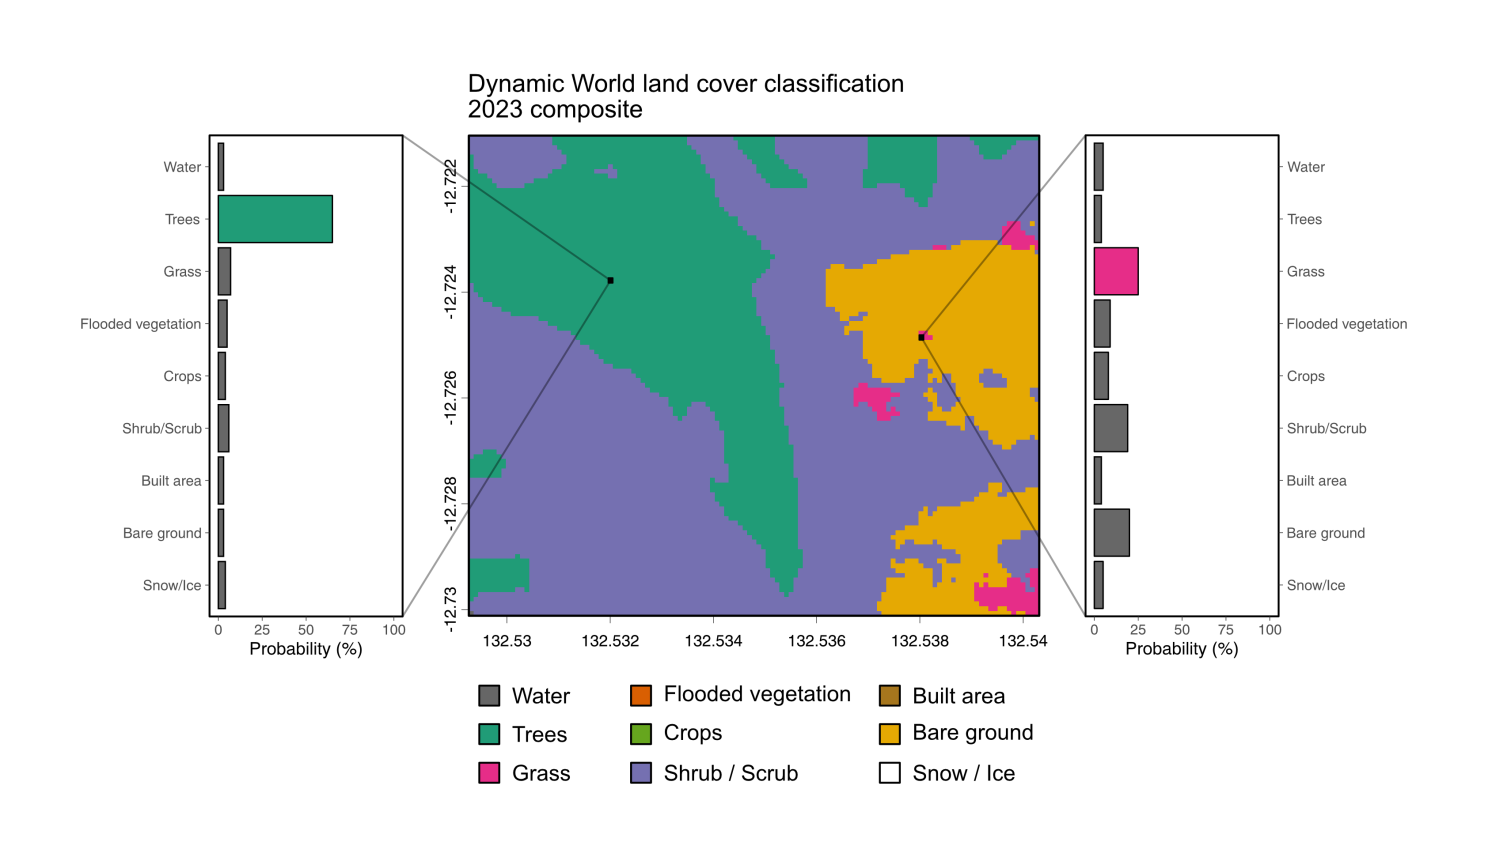
One strength of the Dynamic World dataset is its probabilistic approach. As well as assigning a land cover classification for a pixel, it provides probability scores for each land cover class. This flexibility enables teams to use consensus classifications, set user-defined accuracy thresholds, or create custom classifications by combining probabilities with other datasets.
Looking ahead
Land Use and Land Cover is the second scientific concept we are introducing, alongside Plant Biomass. In future newsletters, we'll explore how different datasets compare, best practices for working with LULC data, and analysis approaches combining LULC with data from other concepts.
Visit our documentation to learn more about our scientific approach, read concept notes on the scientific concepts we support, and explore the datasets available on Cecil today.